Numerous trends and insights on legal operations in more than 400 legal departments were revealed in the third edition of the annual ACC Law Department Management Benchmarking Report released with Major, Lindsey & Africa.
The annual survey captures:
- Patterns in legal spending;
- How departments are staffed across various position types;
- Different areas of the business that are overseen by legal and how different legal work categories are managed; and
- How legal departments are progressing with respect to their Diversity, Equity, and Inclusion (DEI) efforts.
High-level insights are revealed in the publicly available executive summary report. The full benchmarking report is available for purchase and is especially useful for those engaging in benchmarking exercises using industry standard metrics.
Sharp increases in many areas
Five of the more prominent findings from the 2022 survey results are:
1. Inside spend now makes up the majority of total legal spend
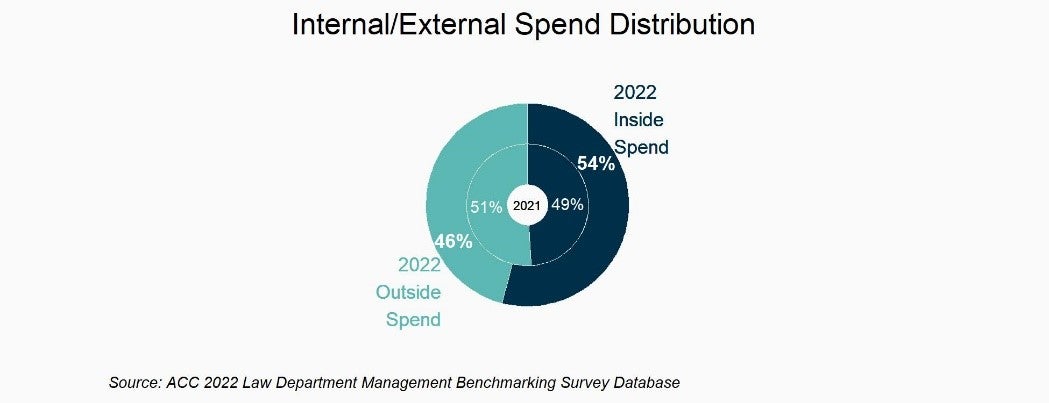
How much is spent on legal inside a company (personnel compensation and overhead) versus outside (law firms and other service providers) is a common metric used among law departments to benchmark their overall resource allocation. Among the overall pool of companies in the survey, the average inside spend was 54 percent of total legal spend, which is the highest percentage observed since ACC began collecting the data.
Among the overall pool of companies in the survey, the average inside spend was 54 percent of total legal spend, which is the highest percentage observed since ACC began collecting the data.
This number is partly driven by a significant number of smaller companies (under US$1 billion in revenue) included in the survey sample, which tend to spend more internally than larger companies. However, the finding does not mean that companies are spending less as a dollar amount on outside counsel — it means a higher proportion of a company’s legal spend is being spent internally. Overall, legal work has increased on average over the past two years due to the impact of COVID-19, merger and acquisitions (M&A) activity, the Great Resignation, and other socio-economic factors.
2. Due diligence and labor and employment work show largest shifts in-house
Legal departments were asked to indicate how 17 work categories are managed: in-house, by outside counsel, through alternative legal service providers (ALSPs), or through a combination of all three, which ACC compared to the results of the 2021 survey.
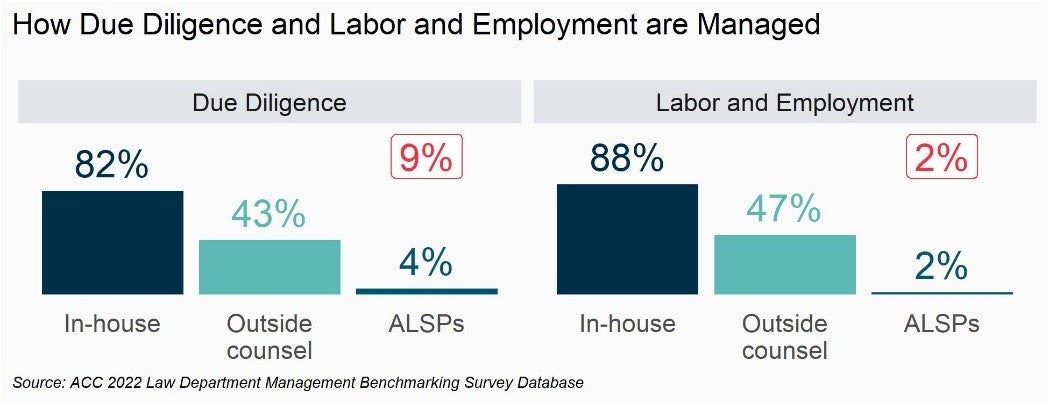
Due diligence and labor and employment (L&E) were the two work categories that showed the largest percentage shifts toward being managed in-house (both six-percentage point increases) with 82 percent of departments saying some portion of their due diligence work is being handled in-house compared to 76 percent last year, and 88 percent saying some portion of their L&E work is being handled in-house compared to 82 percent last year.
Meanwhile, there was a reported eight percent reduction in departments having some portion of their due diligence work handled by outside counsel, so it is likely that there was some degree of work being transferred from law firms to in-house departments. However, there was no associated reduction in the percentage of departments that use outside counsel for a portion of their L&E work, so it appears that there was simply an overall increase in L&E work, with much of that work being added to the in-house workload.
3. CLOs are responsible for more business areas — a trend that has been growing
On average, CLOs are taking on more responsibility across more diverse business areas over time. Environmental, social, and governance (ESG) roles, in particular, have increased, with 15 percent of CLOs handling it in 2021 and 24 percent in 2022.
Environmental, social, and governance (ESG) roles, in particular, have increased, with 15 percent of CLOs handling it in 2021 and 24 percent in 2022.
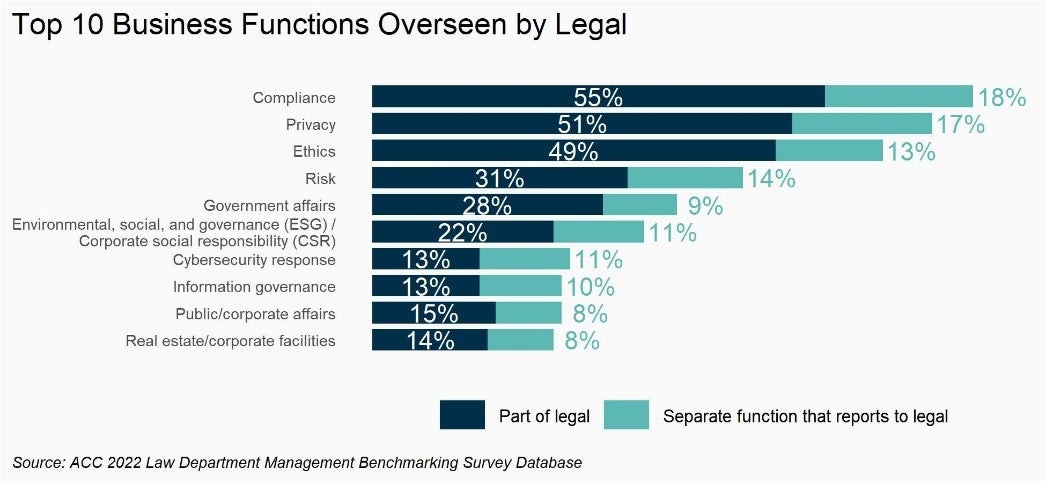
The compliance, privacy, ethics, and risk functions are most often overseen by legal. ESG oversight seems to be growing, with 33 percent of legal departments saying that ESG is either part of, or reports to, the legal department. Cybersecurity and public affairs responsibilities have also been increasing.
4. Legal operations is driving efficiency
Total legal spend as a percentage of revenue is a common performance metric used in benchmarking. It is a standardized measure of a legal department’s overall cost to the business.
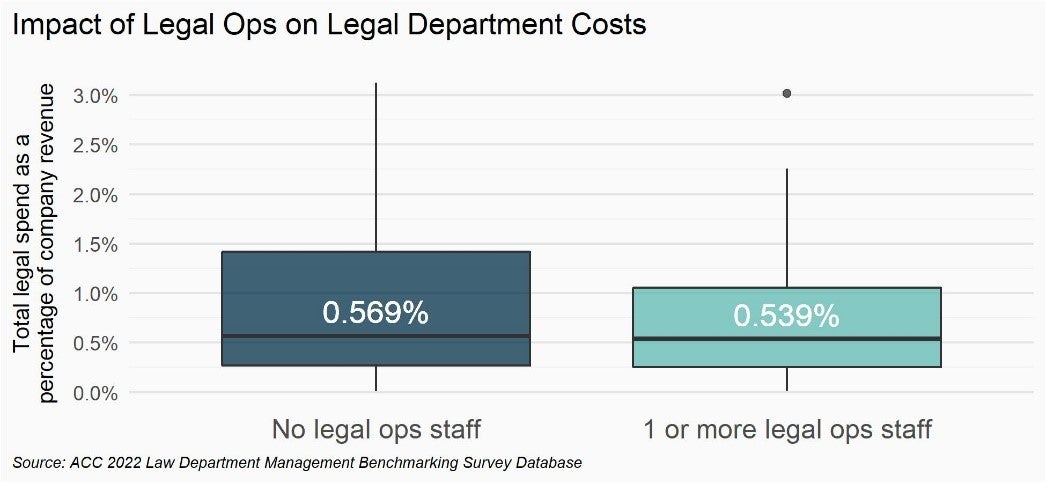
Overall, departments with no legal operations spend more on legal as a percentage of revenue (0.569 percent compared to 0.539 percent). For a US$1 billion company, that’s the difference between $US5.69 million and $US5.39 million or US$300,000. In most companies, this means that the legal ops professional is at least paying for themselves.
However, it is important to note that the distributions in the chart below are partially affected by the different company sizes within both groups. Companies without legal operations staff tend to be smaller, with higher values of legal spend as a percentage of company revenue in general.
5. Progress has been made in establishing diversity metrics with outside counsel, but internal diversity metrics are lagging
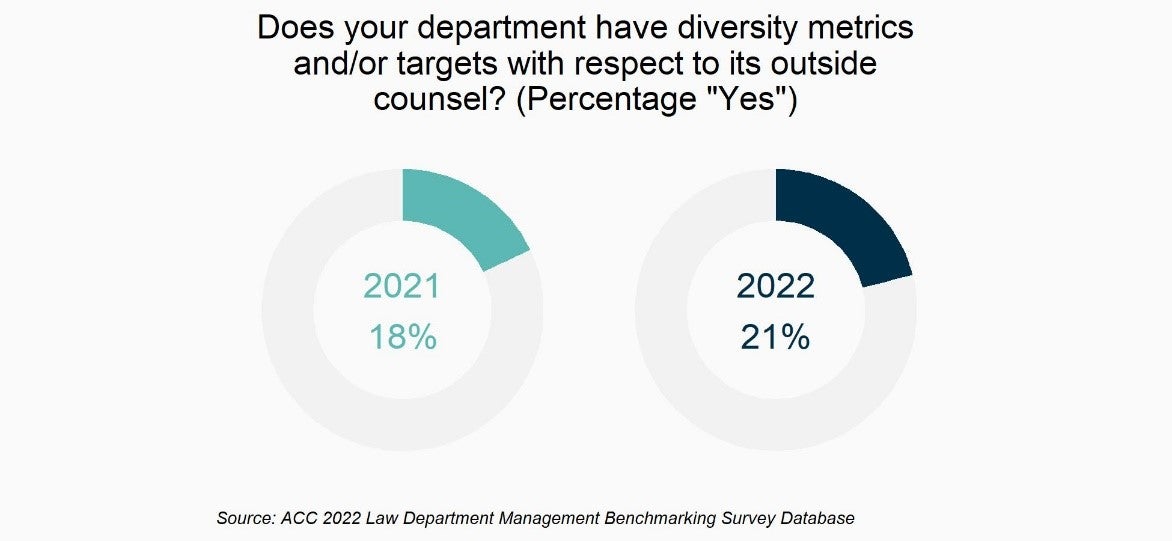
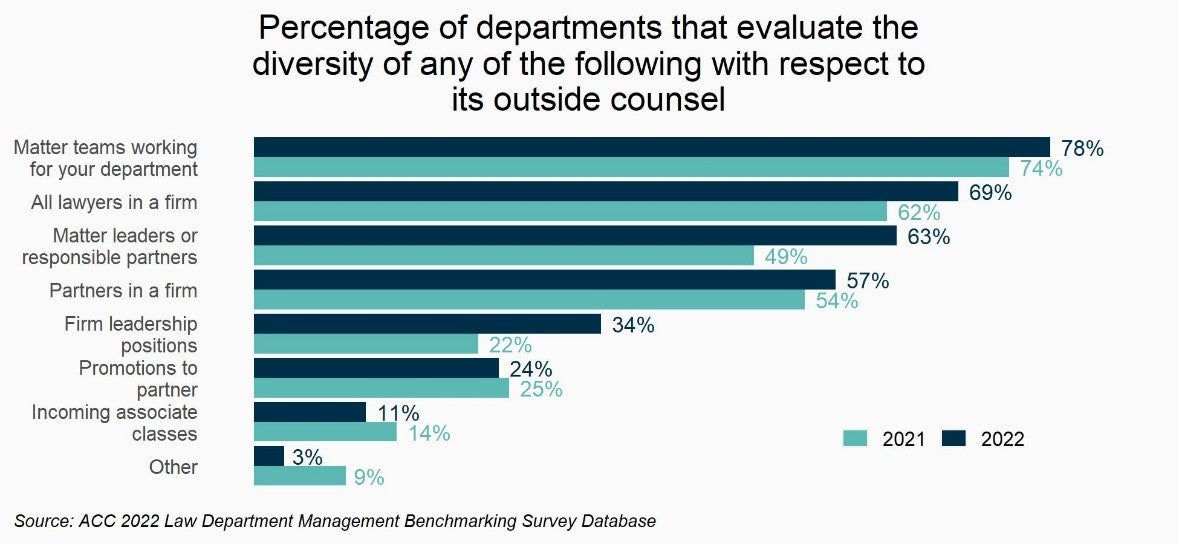
Only 21 percent of departments maintain diversity metrics on their outside counsel — an increase from just 18 percent in 2021. The most common metrics evaluated include diversity among lawyers in a firm the department employs and the firm’s partners and other firm leadership positions, and matter team diversity including among all matter team leaders.
Only 21 percent of departments maintain diversity metrics on their outside counsel — an increase from just 18 percent in 2021.
The percentage of departments that maintain metrics in the majority of these areas has increased substantially the past year, particularly those who measure the diversity of matter leaders and that of firm leadership positions. Although the results show some progress in this area, there hasn’t been a change in the percentage of departments that maintain diversity metrics on the internal composition of their own department’s legal staff, with just 29 percent of departments doing so in both 2021 and 2022.
Learn how to apply the benchmarking results
Although the survey results reveal many interesting findings across these issue areas, the primary purpose of this data collection is to enable ACC members to benchmark their key performance indicators with a broader pool of legal departments. This is why we offer a full benchmarking report and the opportunity to acquire a custom benchmarking report (view sample).
In addition to these reports, which are designed to help you understand how your department stacks up with peers, we also offer a complimentary member-only consultation that can help you take the critical next steps by showing what these results mean and how they can be improved through simple and practical recommendations. Learn how to apply the benchmarking results by requesting a consultation.
Disclaimer: The information in any resource in this website should not be construed as legal advice or as a legal opinion on specific facts, and should not be considered representing the views of its authors, its sponsors, and/or ACC. These resources are not intended as a definitive statement on the subject addressed. Rather, they are intended to serve as a tool providing practical guidance and references for the busy in-house practitioner and other readers.


